Roadmaps for risk mitigation
  • Risk mitigation roadmaps
  • Mitigation Roadmaps
    • Improving generalization through model validation
      • Step 1: Estimating generalization
      • Step 2: Model validation for hyperparameters tuning
      • Step 3: Performing algorithmic selection
      • Additional Material
    • Hyperparameter Optimisation
      • Step 1: Validation
      • Step 2: Hyperparameter Search
      • Additional Considerations
    • Handling dataset shift
      • Step 1: Understanding dataset shifts
      • Step 2: Detecting dataset shifts
      • Step 3: Handling dataset shifts
      • Additional Material
    • Adversarial training for robustness
      • Step 1: Understanding adversarial examples
      • Step 2: Finding adversarial examples
      • Step 3: Defending against adversarial examples
      • Additional Material
    • Data Minimization techniques
      • Step 1: Understanding the data minimization principle
      • Step 2: Data minimization techniques for Supervised Learning
        • Option 1: Reducing features
        • Option 2: Reducing data points
      • Step 3: Other privacy-preserving techniques
      • Additional Material
    • Measuring Bias and Discrimination
      • Step 1: Understanding bias
      • Step 2A: Measuring Bias for Classification tasks
        • Equality of Outcome metrics
        • Equality of Opportunity metrics
      • Step 2B: Measuring Bias in Regression tasks
        • Equality of Outcome metrics
        • Equality of Opportunity metrics
      • Additional Material
    • Mitigating Bias and Discrimination
      • Step 1: Understanding bias
      • Step 2: Mitigating Bias
        • Option 1: Pre-processing
        • Option 2: In-processing
        • Option 3: Post-Processing
      • Additional Material
    • Documentation for improved explainability of Machine Learning models
      • Step 1: Datasheets for Datasets
      • Step 2: Model Cards for Model Reporting
      • Additional Material
    • Extracting Explanations from Machine Learning Models
      • Step 1: Understanding algorithmic explainability
      • Step 2: In-processing methodologies for Explainability
      • Step 3: Post-processing methodologies for Explainability
      • Additional Material
Powered by GitBook
On this page
  1. Mitigation Roadmaps
  2. Extracting Explanations from Machine Learning Models

Step 2: In-processing methodologies for Explainability

PreviousStep 1: Understanding algorithmic explainabilityNextStep 3: Post-processing methodologies for Explainability

Last updated 3 years ago

The easiest way to have explainability is to use models which are easy to interpret. This type of approach is said to be in-process because it is performed at the model design stage, and it is said to be model-specific because it directly depends on the specific machine learning algorithm used.

Decision Tree

There are various types of decision trees, but we can take as an example the classification and regression trees (CART) algorithm. The main idea is that the algorithm learns to classify the input by applying a series of sequential decisions to each feature. The algorithm effectively partitions the feature space into rectangles, and inside each rectangle it fits a simple predictive model.

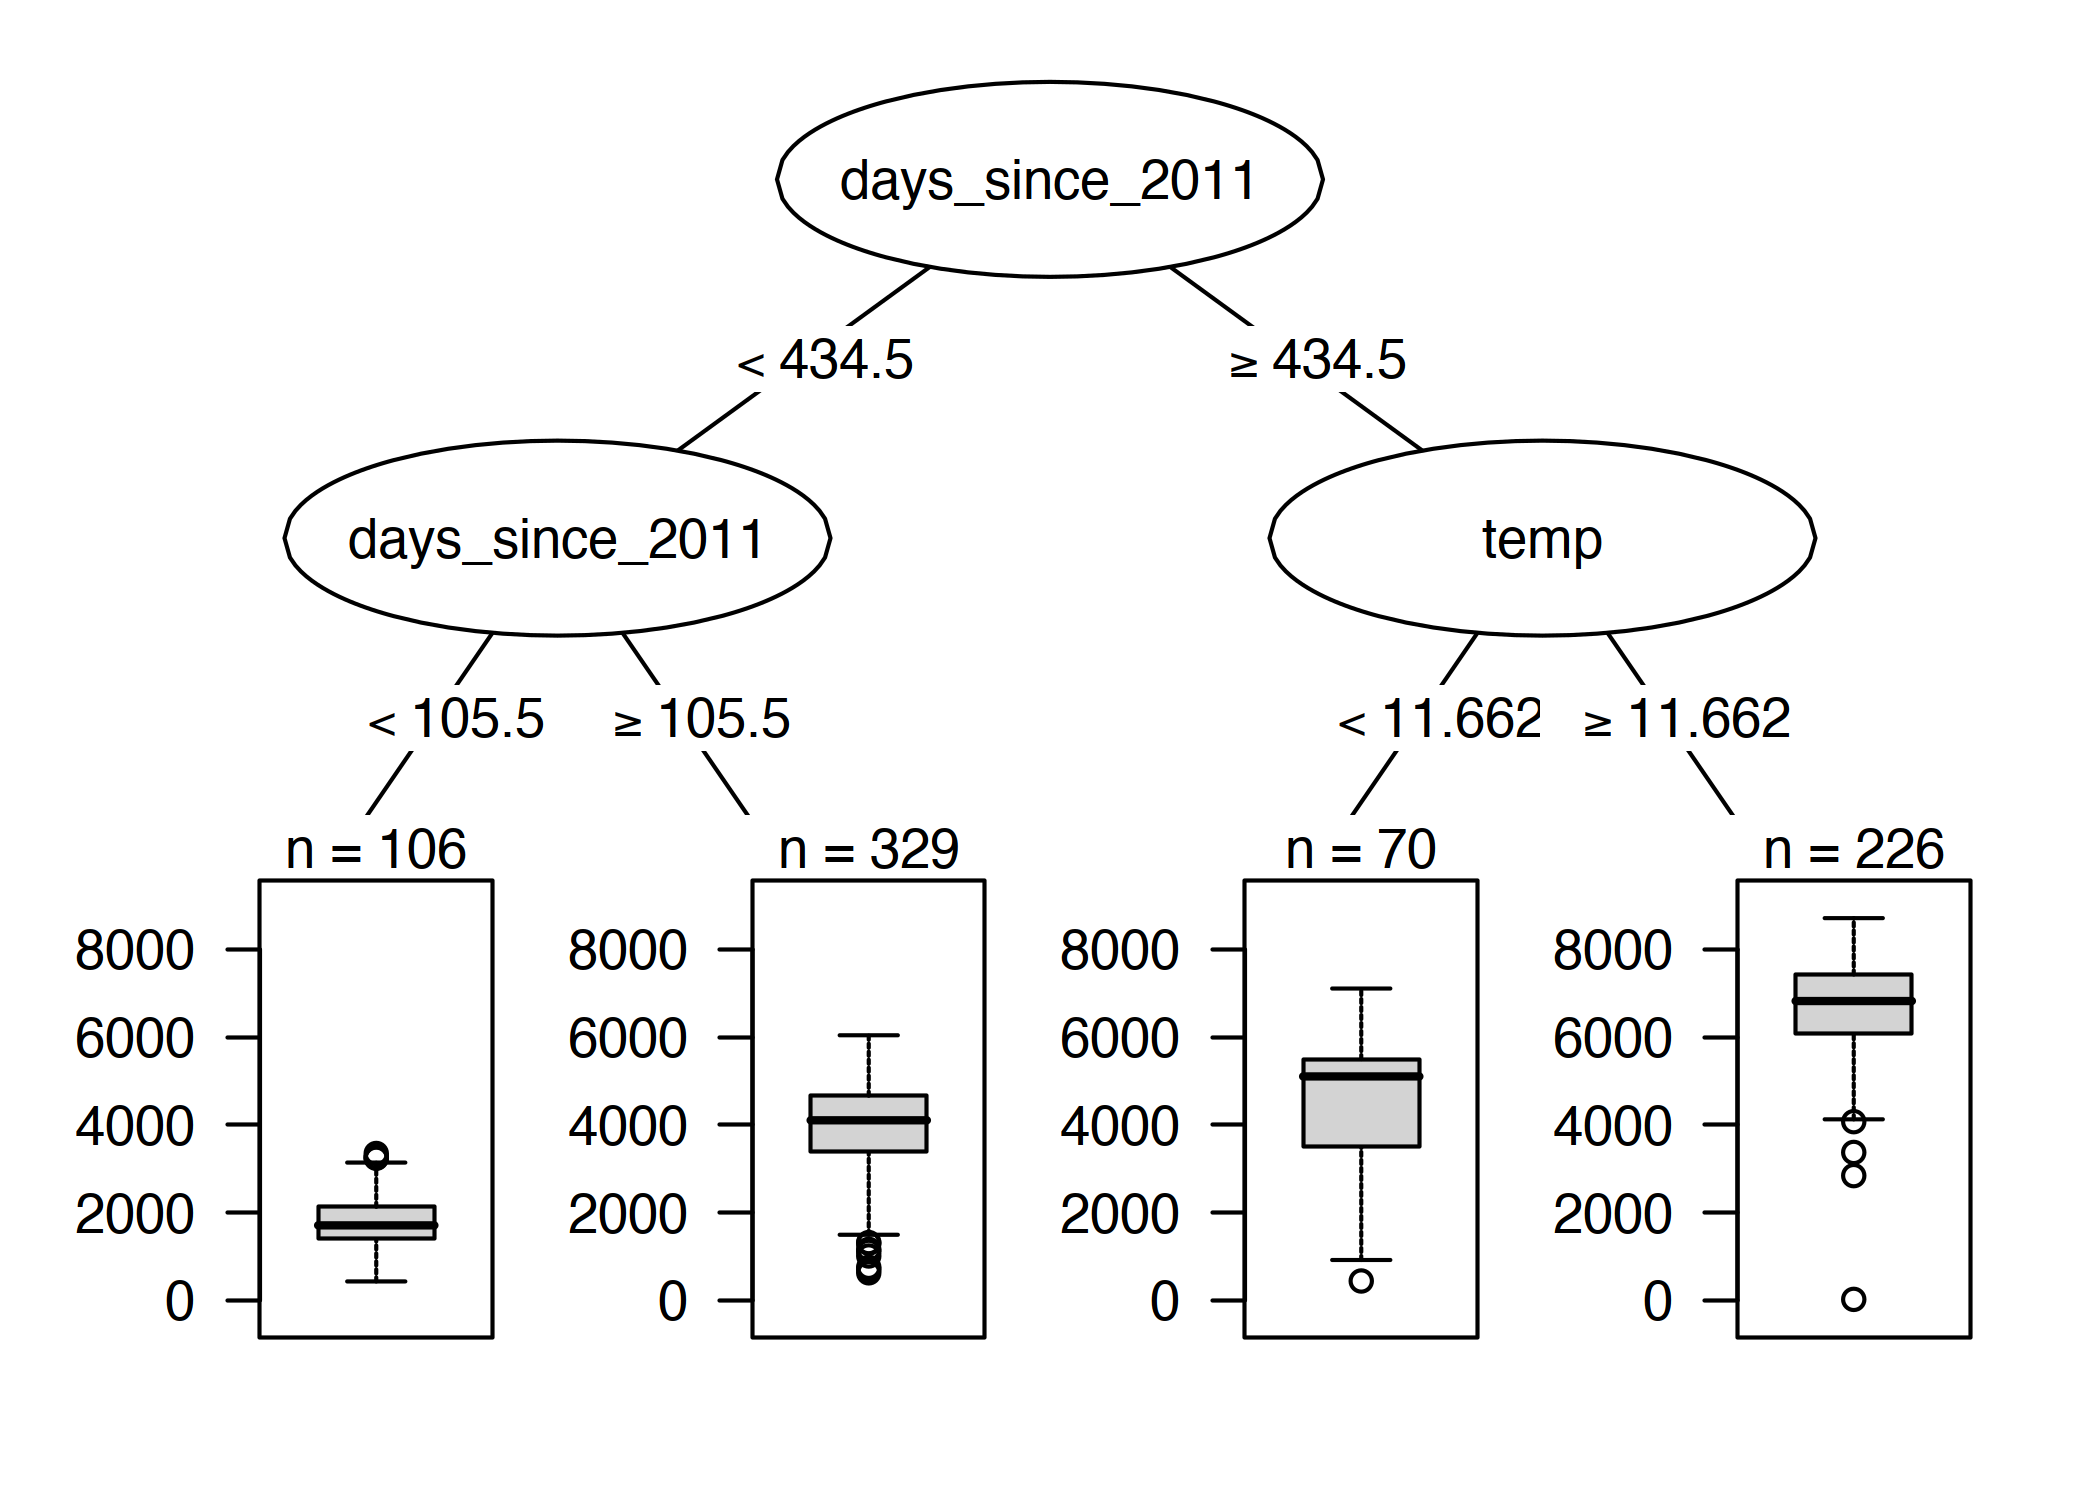
It is pretty straightforward to understand the decision-making process of the algorithm, you can refer to the figure below for clarity. You start from the root node (input data x), then move deeper into the tree by following a series of choices (e.g. is x < 434.5?). With each choice, you move down a level, following either the left or right branch depending on your choice (i.e. your choice will help determine in which subspace your data point belongs). The final node will reveal the predicted outcome.

The model is pretty intuitive, and can provide helpful explanations. Here are some interesting properties:

  • Feature importance can be calculated by going through all the relevant splits and measuring their impact on the variance with respect to the parent node.

  • Individual predictions can be explained by tracking a decision through the whole tree. This allows us to observe the whole decision-making process and the contribution of each decision node.

  • The tree structure provides a clear visualization of the decision-making process.

  • The deeper the tree, the harder it is to have explanations that are human-understandable.

Decision trees for both classification and regression can be implemented in . You can find an example in our notebook, which can be visualized or downloaded below:

sklearn
here
66KB
model-specific-explainability-techniques.ipynb
Example of regression tree, with depth 2. The boxplots show the distribution of target variables in the final node. Figure taken rom the .
Interpretable Machine Learning book